DON’T TRADE THE MARKET ALONE
Sign Up for a Free Test Drive
Of our products and services
STEP 1: Education
Becoming a successful day trader is no easy task. It’s important to make sure you are prepared before diving into the markets. At Investors Underground, we provide top-notch education that allows you to learn from our mistakes and increase your chances of profitability.
STEP 2: Brokers and Tools
In order to be successful in the stock market, you need to make sure you have access to the proper tools. Brokers are one of the most important parts of your trading, so it’s important to choose one that will maximize your trading. Here are a few of our favorites.


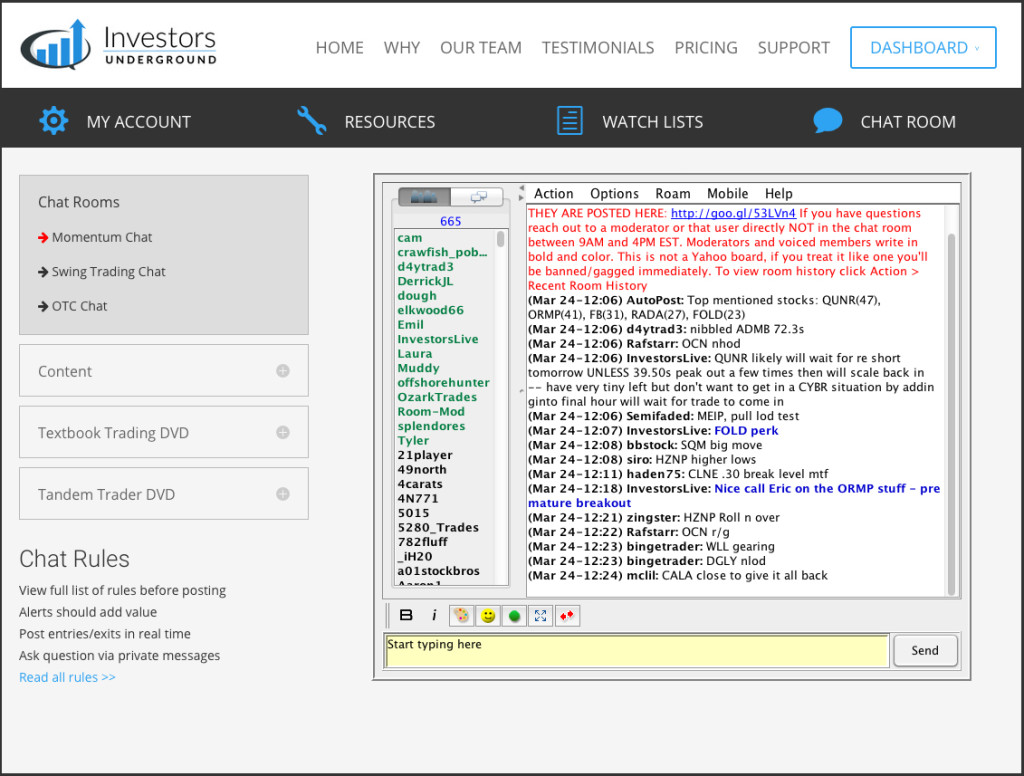
STEP 3: Live Chat
Day trading is a non-stop learning experience. You need to surround yourself with a community that will help you succeed. Investors Underground chat is designed to provide traders with actionable alerts. We also have a team of moderators ready to help answer your questions